Is your computer hanging or freezing while working? If disk space and infections aren’t the issue you may be low on memory. Here are several ways to check.
High memory usage can indicate a number of problems with the computer. The system could be low on physical memory. A program could be malfunctioning causing it to abuse the available memory. High memory usage could also indicate a virus or malware infection.
1.) Open the Task Manager by holding down the Ctrl and Shift keys and pressing Esc.
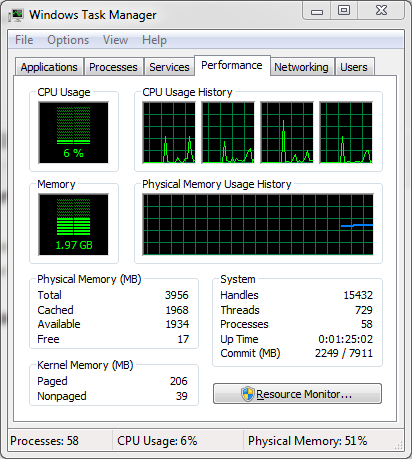
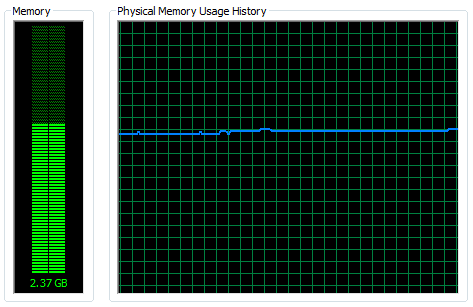
Under the Performance tab, below the CPU Usage graphic there is one for Memory. This gives you a pictorial representation of the amount of memory used. The Physical Memory in megabytes is the amount of Total RAM installed on the computer or Available RAM for handling processes. The amount of physical memory used to map open files is denoted by the Cached entry. Available memory includes Free memory, which is memory currently used for absolutely nothing.
Kernel Memory is used for the operating system and device drivers. Paged memory can be copied to a paging file, freeing more physical memory for use by the operating system. Nonpaged continues to occupy physical memory.
Under System, Commit is the amount of virtual memory that could be backed by physical memory or paging files. The Commit entry depicts a ratio of memory that could be allocated to data to the total virtual memory on the computer.
At the bottom right of the window is the percentage of Physical Memory currently in use.
2.) By clicking the Resource Monitor within the Task Manager, you can view detailed information for memory in use and memory allocated for each process.
User Account Control will bother you for authorization, which you must give to launch the monitor. The Memory tab provides extensive descriptions of the headings of each column if you hover your mouse over each heading.
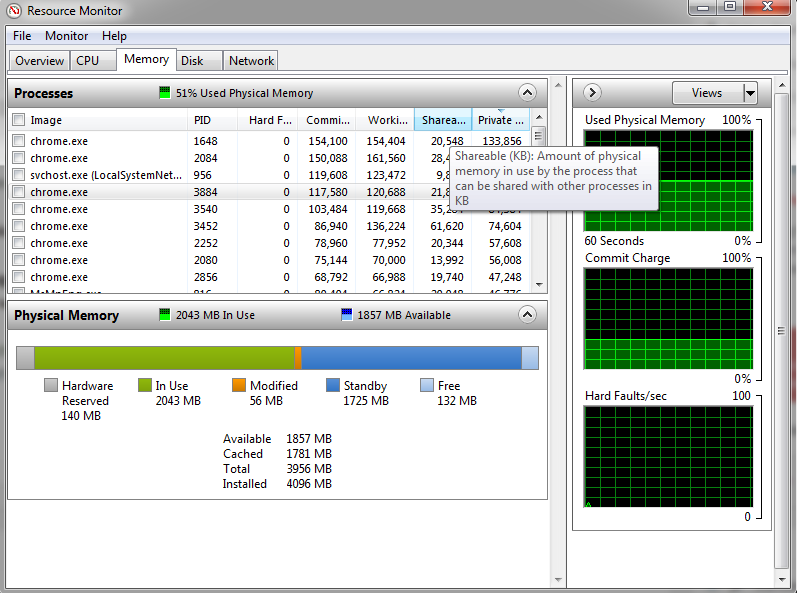
The advantage of the Resource Monitor is that it breaks down memory use on a process by process basis, allowing you to ferret out the resource hogs among your programs.
If you do find unnecessary programs that are taking up an unusual amount of memory, you can uninstall them using the Control Panel or remove them as startup programs. For more on how to remove unnecessary startup programs, please consult the following IT article. And for more on how to uninstall programs and other ways to improve Windows performance, please consult the following IT article.
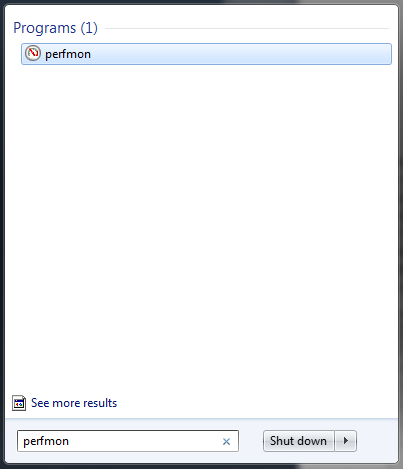
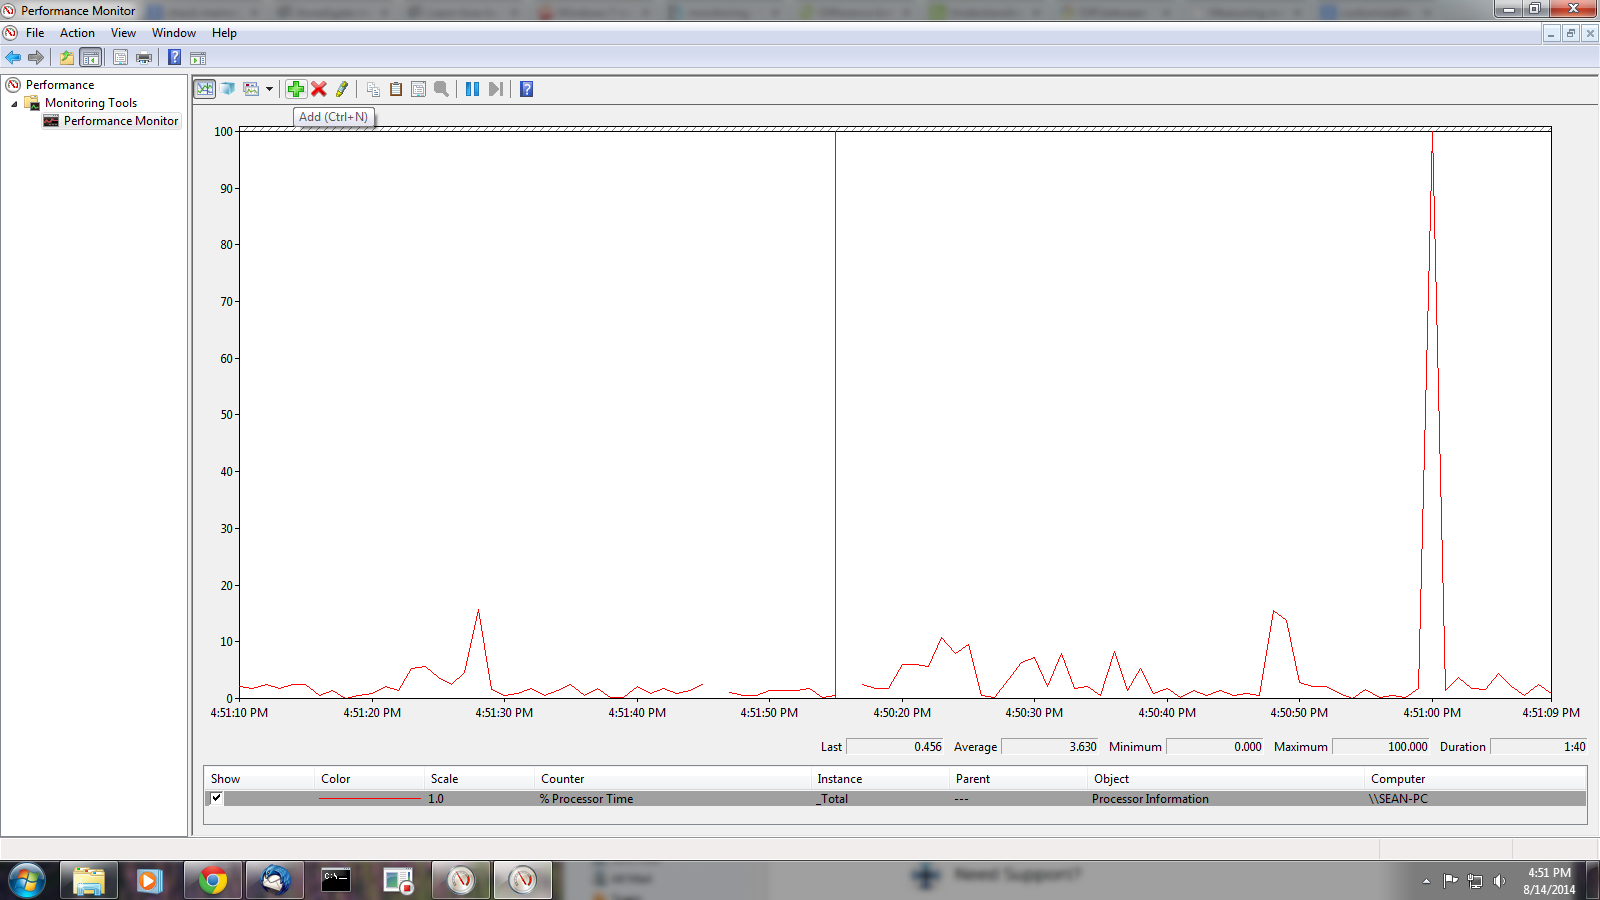
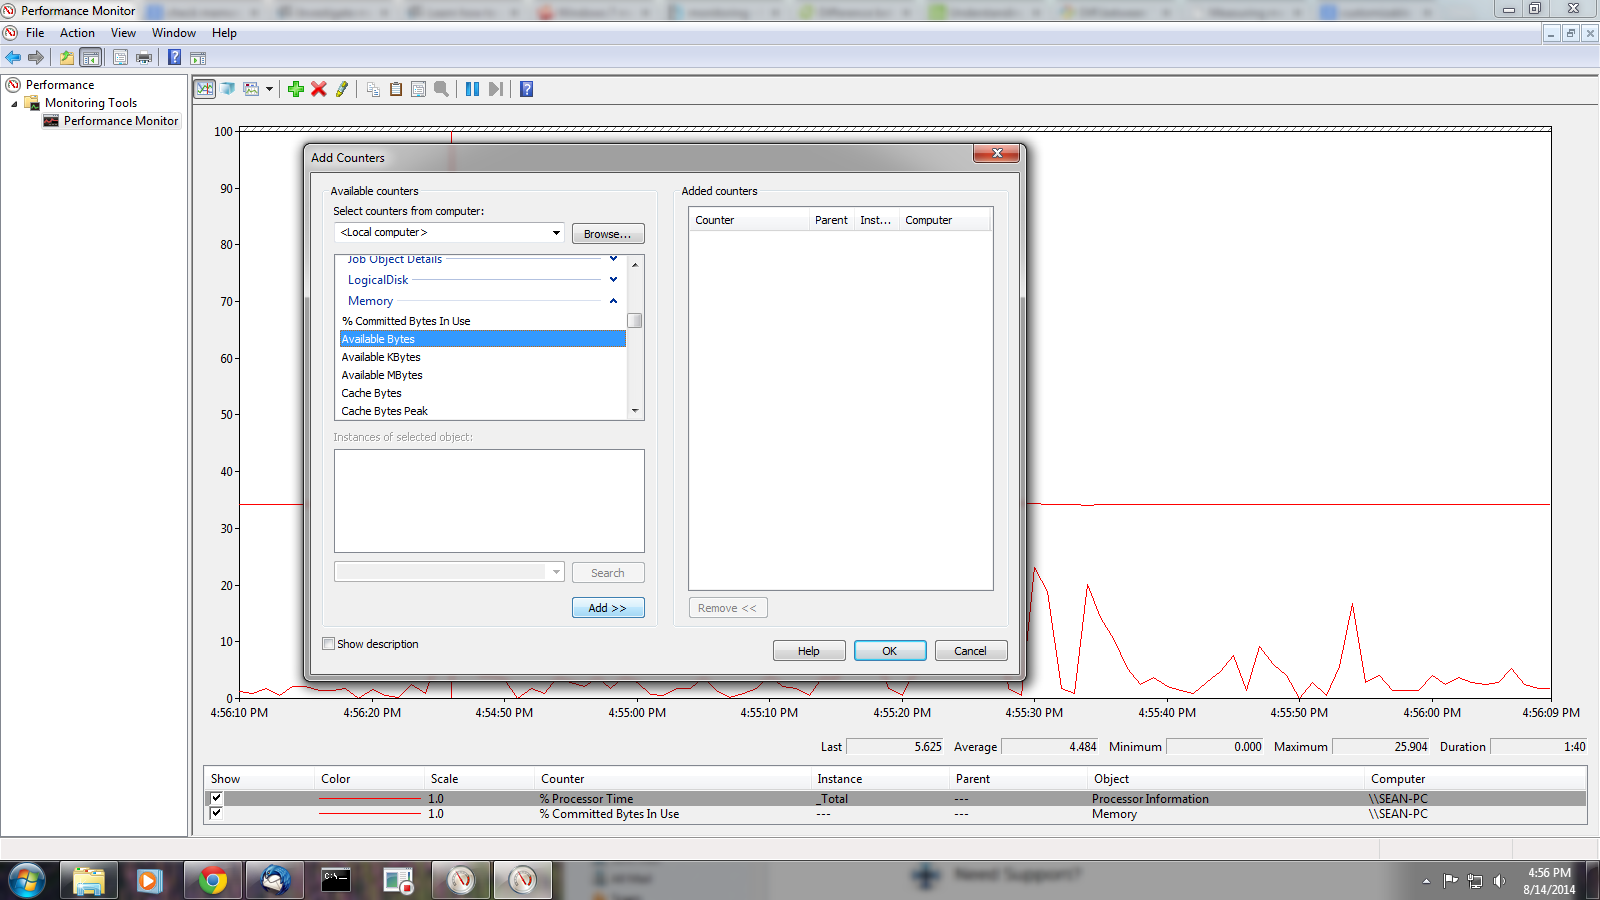
3.) The Performance Monitor is extremely customizable, giving you exactly the performance stats you wish to view.
You can launch it by clicking the Start menu and by typing perfmon.
When it opens, it gives you the basics on how to use it and the memory in use.
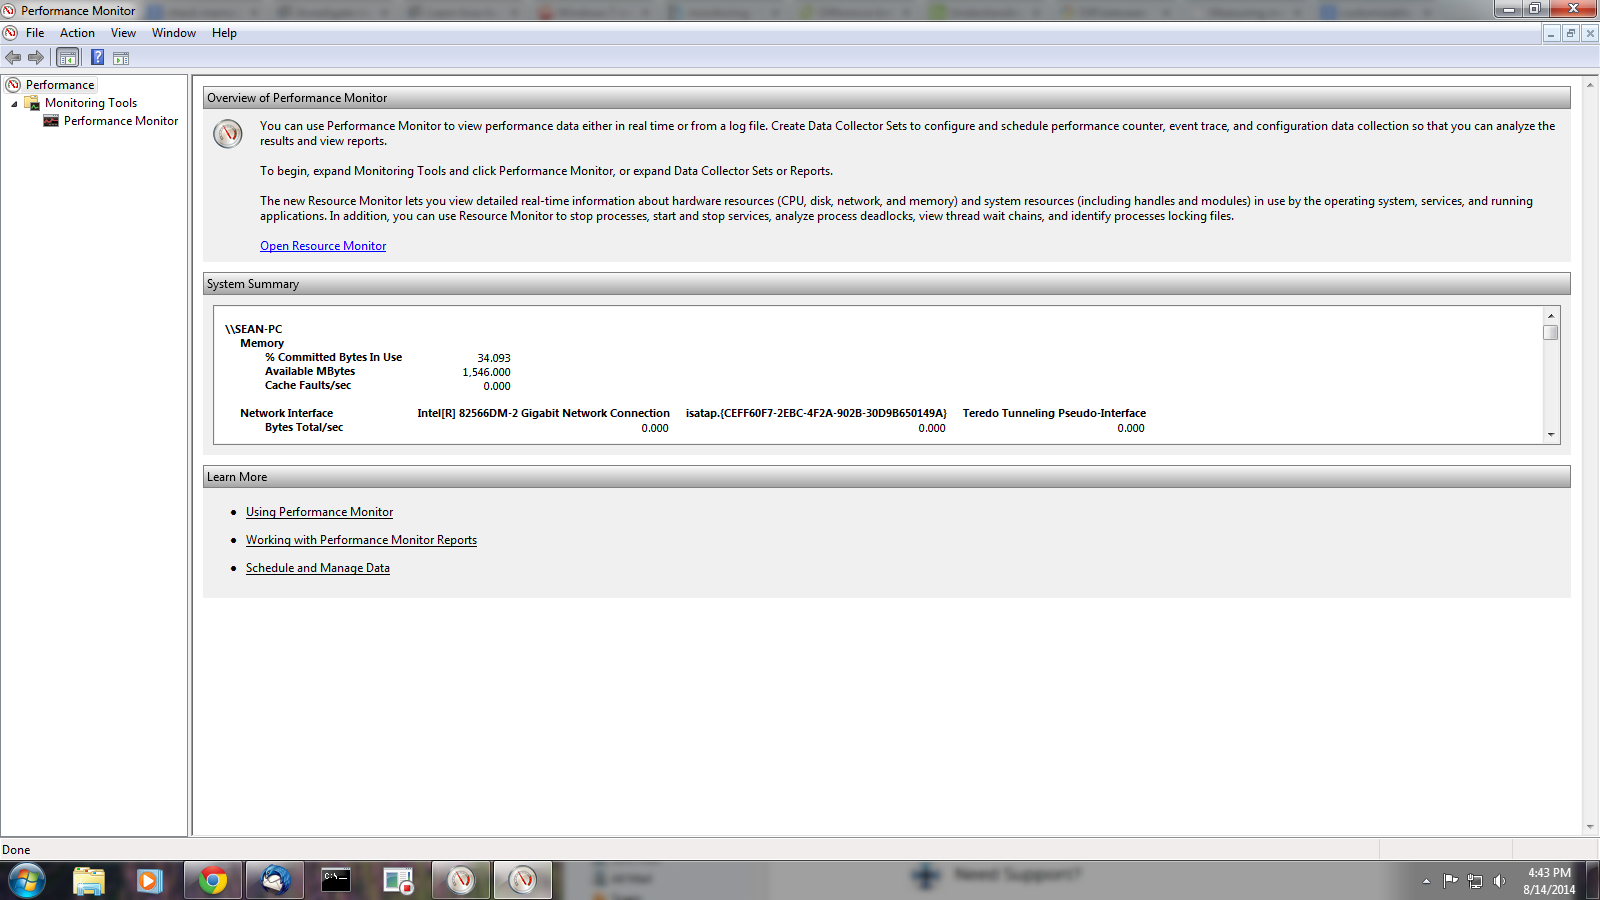
By clicking Performance Monitor on the top left, you get a graph of processor usage that you can complement with memory usage stats by first clicking the + icon to add data to the graph.
Within the Memory heading, you can view the memory of various subheadings that you can add to the graph.
Most end users might be overwhelmed by the number of viewable options available in the Performance Monitor. To get a reasonable assessment of the memory in use, the Task Manager and Resource Monitor generally suffice. The Performance Monitor is recommended for Windows experts who are familiar with the ins and outs of memory usage.
For more about memory and other issues affecting your office systems, consult your local IT professionals.